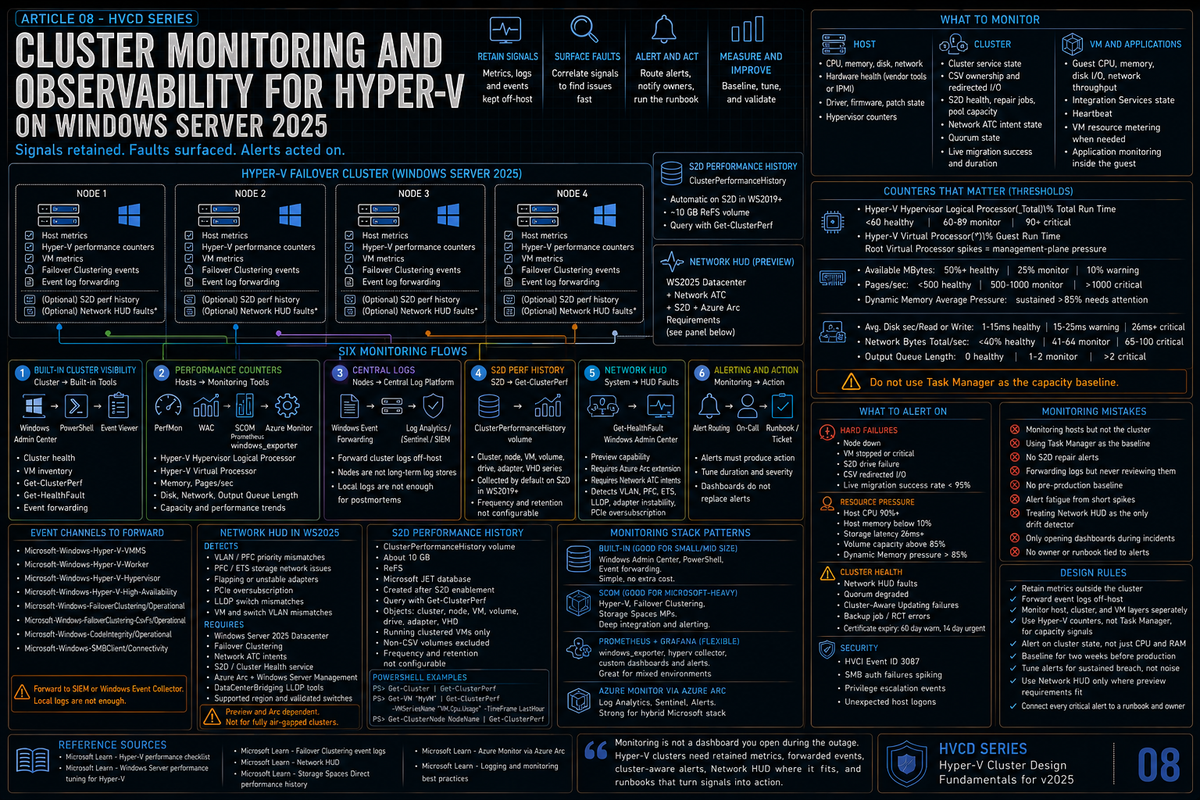
Article 8 in the Hyper-V Cluster Design Fundamentals for Windows Server 2025 series. This article covers cluster monitoring and observability: the host, cluster, and VM metrics that actually matter, the perfmon counters Microsoft documents for Hyper-V, the event log channels you need to forward, Network HUD as the standout new 2025 preview monitoring capability, Storage Spaces Direct performance history via Get-ClusterPerf, and the tool stacks (built in, SCOM, Prometheus, Azure Monitor) that hold up at scale.
Monitoring is the part of cluster design that gets cut first when budgets are tight and that gets cut last when something breaks. Both reactions are wrong. The cluster will tell you what is going wrong before it actually fails, but only if something is listening. The default Windows installation produces plenty of useful telemetry; the work is deciding which signals matter, getting them off the host into a system that can correlate, and setting alerting thresholds that produce action rather than noise.
The point of this article is not to enumerate every counter Hyper-V exposes. It is to identify the signals that catch real problems, the new 2025 capabilities worth knowing, and the tool stack patterns that work for clusters at different scales.
What to monitor: host, cluster, VMs
Three layers, each with its own signals.
| Layer | What matters |
|---|---|
| Host | Physical CPU, memory, disk, network. Hardware health (power, fans, temperatures) via vendor tools or IPMI. Driver and firmware versions. Patch state. The hypervisor performance counters that translate raw CPU into something Hyper-V aware. |
| Cluster | Cluster service state on every node. CSV ownership and redirect mode events. Storage Spaces Direct health (drive failures, repair jobs, pool capacity). Network ATC intent state. Quorum state. Live migration activity and outcomes. |
| VMs | Guest CPU, memory, disk I/O, network throughput. Integration Services state. Heartbeat. VM resource metering when you need chargeback. Application level monitoring inside the guest is its own topic and belongs to the workload owner. |
Most environments cover the host layer well, the VM layer reasonably, and the cluster layer poorly. The cluster layer is where the most expensive failures actually happen.
Hyper-V performance counters that matter
Per Microsoft Learn, Task Manager on the host does not tell you the truth about CPU and memory utilization in a Hyper-V environment. The host operating system is itself a partition, and standard counters do not see the work being done by the hypervisor for child partitions. Use the Hyper-V specific counters instead.
CPU counters
\Hyper-V Hypervisor Logical Processor(_Total)\% Total Run Timemeasures total physical processor utilization across host and all guest operating systems. Per Microsoft Learn (Hyper-V performance checklist), the documented thresholds are: less than 60% consumed = healthy, 60% to 89% = monitor or caution, 90% to 100% = critical with performance adversely affected.\Hyper-V Hypervisor Virtual Processor(*)\% Guest Run Timemeasures the time virtual processors of a VM spend running guest code. This is the right counter for VM CPU pressure.\Hyper-V Hypervisor Root Virtual Processor(*)\% Total Run Timemeasures root partition virtual processor utilization. Spikes here often correlate with management plane activity (backup, live migration, monitoring agents).
Memory counters
\Memory\Available MByteson the host shows physical memory available to the host. Per Microsoft Learn, the documented thresholds (as a percentage of installed physical memory) are: 50% or more free = healthy, 25% free = monitor, 10% free = warning, less than 5% free = critical.\Memory\Pages/secmeasures the rate of hard page faults requiring disk I/O. Per Microsoft Learn: less than 500 = healthy, 500 to 1000 = monitor, greater than 1000 = critical. High pages per second combined with low available memory indicates a lack of physical memory.\Memory\Committed Bytesshows committed memory and helps identify the trend toward pressure before you actually run out.\Hyper-V Dynamic Memory VM(*)\Average Pressuredisplays the ratio of committed memory within the VM to the memory allocated to the VM. Per Microsoft Learn, sustained values above 85% (assuming the default 20% memory buffer) warrant attention; values approaching or exceeding 100 indicate the VM does not have enough memory and is page faulting.
Disk and network counters
\LogicalDisk(*)\Avg. Disk sec/Readand\LogicalDisk(*)\Avg. Disk sec/Writeon the host expose disk latency. Per Microsoft Learn, documented thresholds are 1ms to 15ms = healthy, 15ms to 25ms = warning, 26ms or greater = critical with performance adversely affected. Per Microsoft Learn (Hyper-V Performance Storage), 15ms is a general threshold but server virtualization often requires lower values, often 8ms or lower.\Network Interface(*)\Bytes Total/secmeasures network throughput as a percentage of adapter bandwidth. Per Microsoft Learn: less than 40% consumed = healthy, 41% to 64% = monitor, 65% to 100% = critical.\Network Interface(*)\Output Queue Lengthmeasures the number of threads waiting on the network adapter. Per Microsoft Learn: 0 = healthy, 1 to 2 = monitor, greater than 2 = critical with performance adversely affected.\Hyper-V Virtual Storage Device(*)\counters expose per VM virtual disk metrics including read and write bytes per second. Per Microsoft Learn, when Integration Services are loaded, both virtual IDE and SCSI activity show up in this counter set. Useful when you need to attribute storage pressure to a specific VM.
Per Microsoft Learn, the standard \Processor(*)\% Processor Time counter inside a guest reports utilization relative to the virtual processors allocated to the VM, not the actual physical CPU pressure. A VM showing 100% on this counter may be CPU starved, or it may be perfectly fine and just busy on virtual CPUs that are themselves not waiting for the physical scheduler. Use the host side Hyper-V counters for the truth.
Event log channels worth forwarding
Hyper-V and Failover Clustering write to specific event log channels under Applications and Services Logs\Microsoft\Windows\. These are the ones to forward to your SIEM or central event collector.
| Channel | What it captures |
|---|---|
Microsoft-Windows-Hyper-V-VMMS | VM lifecycle events from the Virtual Machine Management Service: VM start, stop, failover, configuration changes, errors during VM operations. |
Microsoft-Windows-Hyper-V-Worker | Per VM worker process events. The VM specific errors that explain why a particular VM is unhealthy land here. |
Microsoft-Windows-Hyper-V-Hypervisor | Hypervisor level events including initialization, partition creation, and certain platform errors. |
Microsoft-Windows-Hyper-V-High-Availability | Cluster integration events for VMs running on a failover cluster. |
Microsoft-Windows-FailoverClustering/Operational | Cluster service state changes, role moves, node up and down events, quorum state changes. The event log to read first when something cluster wide goes wrong. |
Microsoft-Windows-FailoverClustering-CsvFs/Operational | CSV file system events. Redirect mode entries and exits show up here. |
Microsoft-Windows-CodeIntegrity/Operational | HVCI events including blocked drivers (Event ID 3087 per Microsoft Learn). Relevant during and after upgrades to 2025. |
Microsoft-Windows-SMBClient/Connectivity | SMB client side connection events. Useful for diagnosing storage path issues to SOFS or SMB based backup repositories. |
Forward to a SIEM or centralized Windows Event Collector. The cluster nodes themselves should not be the long term log store for their own events.
Network HUD: the new 2025 monitoring capability (preview)
Network HUD is the standout new preview monitoring capability in Windows Server 2025. Treat the preview label seriously, verify eligibility and regional availability for your environment, and do not design an isolated or air gapped monitoring strategy around it. Where the requirements fit, it is worth evaluating because it catches the exact host networking drift that causes expensive S2D and cluster incidents. Per Microsoft Learn, Network HUD is a host networking diagnostics and operational tool that runs locally on each cluster node, correlating physical switch links, host adapter settings, and the cluster roles that consume them. It uses Network ATC intent data to select relevant tests and raises early alerts when emerging issues threaten workload performance or stability.
What Network HUD detects
Per Microsoft Learn, Network HUD detects:
- Misconfiguration on the physical network (missing VLAN or PFC priority)
- Operational hardware issues (flapping or unstable adapters, PCIe oversubscription)
- Inconsistent storage issues with physical network configuration (PFC/ETS)
- Misconfigured network configurations such as VLAN mismatches between switches and VMs
- Switch LLDP mismatches between fabric and host configuration
Requirements
Per Microsoft Learn, Network HUD requires:
- Windows Server Failover Clustering
- Cluster nodes running Windows Server 2025 Datacenter
- Network ATC deployed with host networking intents
- Storage Spaces Direct enabled (required for the Cluster Health service)
- Each cluster node connected to Azure Arc
- Eligibility for Windows Server Management enabled by Azure Arc
- DataCenterBridging LLDP Tools installed
- Network HUD availability in your Azure region (verify supported regions)
- Physical switches that meet the applicable Azure Local validated switch and switch requirement guidance
The Azure Arc requirement is the operational gotcha: Network HUD is delivered as an Arc extension. You cannot run it on a fully air gapped cluster. For most enterprise clusters with internet connectivity this is fine; for sovereign or isolated environments it does not apply. Confirm both regional availability and Windows Server Management eligibility before planning a rollout.
How to query faults
Per Microsoft Learn, Network HUD publishes health faults through the cluster health pipeline. You can query them with PowerShell:
Faults also surface in Windows Admin Center. The cluster health pipeline is the integration surface, which means downstream tools that already consume cluster health (SCOM, Prometheus exporters that read health faults, Azure Monitor via Arc) get the Network HUD signals automatically once the feature is enabled.
Network ATC (covered in article 2) declares your network configuration: intents, adapter mappings, VLANs, switches. Network HUD watches whether your actual network state matches what ATC declared, and tells you when it does not. They are complementary. ATC is configuration; HUD is observability of that configuration.
Storage Spaces Direct performance history
Per Microsoft Learn, Storage Spaces Direct includes built in performance history collection by default. Shortly after S2D is enabled, an approximately 10 GB volume named ClusterPerformanceHistory is created and an instance of the Extensible Storage Engine (Microsoft JET) is provisioned there. The volume uses ReFS and stores the performance history without administrator involvement.
What gets collected
Per Microsoft Learn, performance history is collected for seven types of objects: cluster, ClusterNode, VM, volume, drive, network adapter, and VHD. Each object type has many series. For example, ClusterNode.Cpu.Usage is collected for each server. Volume.Iops.Total is collected for each CSV.
Querying with Get-ClusterPerf
Microsoft documents the Get-ClusterPerf cmdlet for scripting against this data. Examples from Microsoft Learn:
Per Microsoft Learn, the cmdlet pipes cleanly into Sort-Object, Where-Object, and Measure-Object for ad hoc analysis. Microsoft publishes sample scripts that find peak values, compute averages, plot trend lines, and run outlier detection.
Caveats
Per Microsoft Learn:
- Performance history is collected by default with Storage Spaces Direct in Windows Server 2019 and later. Not available on Windows Server 2016 or earlier.
- Performance history is available for every running clustered VM, but not for VMs that are not clustered. Volumes that are not Cluster Shared Volumes are excluded.
- The measurement frequency and retention period are not currently configurable.
- To stop performance history collection, run
Stop-ClusterPerformanceHistory. To prevent it from starting at deployment, set-CollectPerformanceHistory $FalseonEnable-ClusterStorageSpacesDirect.
Tool stacks for cluster monitoring
The right monitoring stack depends on cluster scale, team skills, and existing tooling. Four patterns work, with different tradeoffs.
Built in (Windows Admin Center plus PowerShell plus event forwarding)
Windows Admin Center provides cluster level dashboards out of the box including health faults, performance charts backed by Get-ClusterPerf, S2D drive health, and VM inventory. Event forwarding to a Windows Event Collector or to Microsoft Sentinel covers the audit and detection side.
Right answer for: small to mid sized environments (one to two clusters, fewer than 100 VMs), teams without dedicated monitoring engineering, environments that already have Sentinel for security telemetry.
Limits: dashboards are point in time, alerting requires building on Sentinel or PowerShell scheduled tasks, no native multi cluster aggregation beyond what WAC presents.
System Center Operations Manager (SCOM)
SCOM remains a credible enterprise monitoring platform for Microsoft heavy environments. The Hyper-V Management Pack, Failover Clustering Management Pack, and Storage Spaces Management Pack give you out of the box discovery, predefined health rollup logic, and alerting. SCOM 2025 supports Windows Server 2025 hosts.
Right answer for: organizations with existing SCOM investments and Microsoft licensing that already covers it, environments where the operations team already knows the SCOM model.
Limits: licensing cost, agent management overhead, less popular with newer DevOps oriented teams. The architecture predates the modern observability movement and feels heavy by comparison.
Prometheus and Grafana with windows_exporter
Open source monitoring stack with no licensing cost. The windows_exporter project (formerly wmi_exporter) is the official Prometheus exporter for Windows metrics and includes a dedicated hyperv collector that exposes Hyper-V performance counters as Prometheus metrics. Grafana provides dashboards and alerting.
Right answer for: organizations with existing Prometheus and Grafana investments, teams comfortable with infrastructure as code and self managed monitoring, mixed Windows and Linux environments where you want one stack.
Limits: you build the dashboards and alerting rules yourself. Out of the box content for Hyper-V is community maintained and not as mature as the SCOM management packs.
Azure Monitor via Azure Arc
Cluster nodes registered with Azure Arc can be monitored from Azure Monitor without running their workloads in Azure. The Arc agent forwards events and performance counters to Log Analytics; alerting and dashboarding happen in Azure.
Right answer for: hybrid environments that already have an Azure Monitor footprint, organizations standardizing on Microsoft Defender for Cloud and Sentinel, teams that want a single pane across on prem and cloud workloads.
Limits: monthly cost based on log ingestion volume, Azure Arc connectivity requirement, some on prem specific signals do not have direct Azure Monitor equivalents.
What to alert on
Alerting badly is worse than not alerting. The goal is alerts that produce action, not noise. Alert thresholds are environment specific, but these are the categories that consistently warrant alerts on Hyper-V clusters.
Hard failures
- Cluster node down (Microsoft-Windows-FailoverClustering/Operational)
- VM unexpectedly stopped or in critical state (Microsoft-Windows-Hyper-V-Worker, Microsoft-Windows-Hyper-V-VMMS)
- Storage Spaces Direct drive failure or unhealthy state
- CSV unavailable or stuck in redirected I/O for an extended period
- Live migration failures (success rate dropping below 95% in a 24 hour window is a strong signal)
Resource pressure
- Host CPU sustained above 90% (per Microsoft Learn critical threshold for
\Hyper-V Hypervisor Logical Processor(_Total)\% Total Run Time) - Host available memory below 10% of physical RAM (per Microsoft Learn warning threshold)
- Storage latency exceeding 25ms sustained on volumes hosting VMs (per Microsoft Learn critical threshold)
- Storage volume above 85% capacity
- Storage Spaces Direct pool free capacity falling below the documented reserve requirement (one capacity drive per server, up to four drives, per Microsoft Learn).
Get-ClusterS2DStorageUsagereturns the calculated reserve required against current free space - VM with Average Pressure sustained above 85% when using Dynamic Memory
Cluster health
- Network HUD faults (the whole point of HUD is early warning before networking degrades workload performance)
- Quorum state degraded
- Cluster Aware Updating run failures
- Backup job failures or RCT errors (covered in article 7, but the alert lives in monitoring)
- Certificate expiry approaching (60 day warning, 14 day urgent) for cluster, host, and SOFS certificates
Security
- HVCI driver block events (Event ID 3087)
- SMB authentication failures spiking (the rate limiter from article 6 will throttle attacks but you still want to know)
- Privilege escalation events on cluster nodes
- Unexpected logons to host operating system at unusual hours
The monitoring mistakes that bite you later
Monitoring the host but not the cluster
Catching that a node is at 90% CPU is operations 101. Catching that the cluster is in degraded quorum, that a CSV is in redirect mode, or that S2D is rebuilding from a drive failure requires actually monitoring cluster level state. Most environments instrument the host layer well and the cluster layer poorly.
Using Task Manager metrics on the host or in VMs as your baseline
Per Microsoft Learn, Task Manager does not see what the hypervisor is doing. The host counters report the root partition only. The guest counters lie about physical CPU pressure when oversubscribed. Use the Hyper-V perfmon counters or accept that your data is misleading.
No alerting on Storage Spaces Direct repair operations
S2D will repair itself after a drive failure as long as you have the capacity. If you do not know the repair is in progress, you do not know that the second drive failure during the repair window will take down the volume. Alert on repair start, repair duration, and pool free capacity dropping during repair.
Forwarding logs but never looking at them
An event collector that nobody reads is a backup that is never tested. Build at least a daily summary view of cluster events and assign someone to check it. Better: set up alerting on the specific event IDs you care about so the event log forwarding actually drives action.
No baseline before the cluster is in production
Without a quiet period baseline, you have no idea what normal looks like. Capture two weeks of metrics during pilot and after each major workload addition. Without it, your alert thresholds are just somebody's guesses.
Alert fatigue
Pages at 3 AM that turn out to be a brief CPU spike train your team to ignore alerts. Tune thresholds and durations so an alert means something is genuinely wrong. Five minute sustained breach is usually a better trigger than instantaneous threshold crossing.
Treating Network HUD as the only path to detecting host networking drift
Network HUD is preview and Arc dependent, which means it does not fit every environment. If you can connect the cluster to Arc and meet the preview requirements, evaluate it: the category of problems it catches (LLDP mismatches, VLAN mismatches, PFC and ETS issues, driver drift, flapping adapters before they fail outright) are exactly the problems that cause expensive incidents on hyperconverged clusters. If you cannot, because of sovereign requirements, isolated networks, or other constraints, document compensating detections for the same categories: LLDP drift, VLAN mismatches between switches and hosts, PFC/ETS misconfiguration, driver and firmware drift, and adapter link flap rates. The point is to know about those problems before they degrade the cluster, regardless of which tool catches them.
Treating monitoring data as a debugging aid only
The most useful monitoring data is the data you look at before something breaks: capacity trending, performance baselines, slow drift toward thresholds. If your team only opens the dashboards during incidents, you are using a small fraction of the value the monitoring stack provides.
Key Takeaways
- Three layers to monitor: host, cluster, VMs. Most environments cover host well, VM reasonably, cluster poorly. The cluster layer is where the most expensive failures happen.
- Use Hyper-V specific perfmon counters, not Task Manager. Per Microsoft Learn,
\Hyper-V Hypervisor Logical Processor(_Total)\% Total Run Timedocumented thresholds: less than 60% healthy, 60 to 89% monitor, 90 to 100% critical. - Forward the right event log channels: Microsoft-Windows-FailoverClustering/Operational, Microsoft-Windows-Hyper-V-VMMS, Microsoft-Windows-Hyper-V-Worker, CodeIntegrity/Operational, FailoverClustering-CsvFs/Operational.
- Network HUD is the standout 2025 monitoring capability and is currently in preview. Detects VLAN mismatches, PFC/ETS misconfiguration, LLDP drift, flapping adapters, PCIe oversubscription. Requires WS2025 Datacenter, Network ATC with intents, S2D enabled, Azure Arc connection with Windows Server Management eligibility, DataCenterBridging LLDP Tools, and Azure regional availability. Treat the preview label seriously and verify eligibility before relying on it.
- Storage Spaces Direct performance history is built in via Get-ClusterPerf. Per Microsoft Learn, an approximately 10 GB ClusterPerformanceHistory volume is created automatically when S2D is enabled. Available for cluster, node, VM, volume, drive, network adapter, and VHD.
- Tool stack pattern depends on scale. Built in (WAC plus PowerShell plus event forwarding) for small environments; SCOM for Microsoft heavy enterprises; Prometheus and Grafana with windows_exporter for DevOps oriented teams; Azure Monitor via Arc for hybrid environments.
- Alert on hard failures, resource pressure, cluster health, and security. Tune thresholds and require sustained breach (5 minutes typical) before paging to avoid alert fatigue.
- Baseline two weeks before going to production. Without a baseline, your alert thresholds are guesses.
- Storage Spaces Direct repair operations need explicit alerting. Repair start, duration, and pool free capacity during repair. A second drive failure during a repair window can take a volume offline.
- Monitoring data is most valuable before something breaks. Capacity trending, baseline drift, and early warning signals are the operational gold; reactive dashboarding during incidents is a small fraction of what the stack should do for you.