

A Nutanix cluster reports on itself by default. The question is whether you have routed that signal somewhere a human or a system will act on it, and whether you can tell the difference between a transient blip and the first sign of a failure domain going dark. This article maps the monitoring surfaces in AOS 7.3 and Prism Central 7.3, what each one owns, and how to get the data out to the tools your operations team already runs.
SurfacesWhere monitoring actually lives
Nutanix splits observability across three layers, and confusing them is the source of most monitoring gaps. Each layer owns a different scope and answers a different question.
| Surface | Scope | What it answers |
|---|---|---|
| Prism Element | Single cluster | Live health, hardware, per node and per VM stats, the Health dashboard, NCC results for that cluster |
| Prism Central | Fleet of registered clusters | Cross cluster alerts, aggregated metrics, reporting, syslog forwarding, capacity behavior, RBAC scoped views |
| Nutanix Insights | SaaS, all Pulse enabled clusters | Predictive health, automatic case creation, known issue matching against the support corpus |
Prism Element is the floor. It runs on the cluster itself and survives the loss of Prism Central, which is why the deepest hardware and disk telemetry stays there. Prism Central is where a fleet is operated from: it is the only place that sees more than one cluster at a time, and it is where alert policies, reports, and log forwarding are configured for everything registered to it. Insights sits off cluster entirely and only sees what Pulse sends it.
Prism Central is a workload. It runs as one or three VMs and has its own resource, backup, and availability story. A single Prism Central VM that dies takes fleet wide alerting and reporting with it while the clusters keep running blind to a central operator. Scale out Prism Central sizing is covered in NCD-10. Treat the monitoring plane as something that itself needs to be monitored, which is why Prism Element health never depends on Prism Central being up.
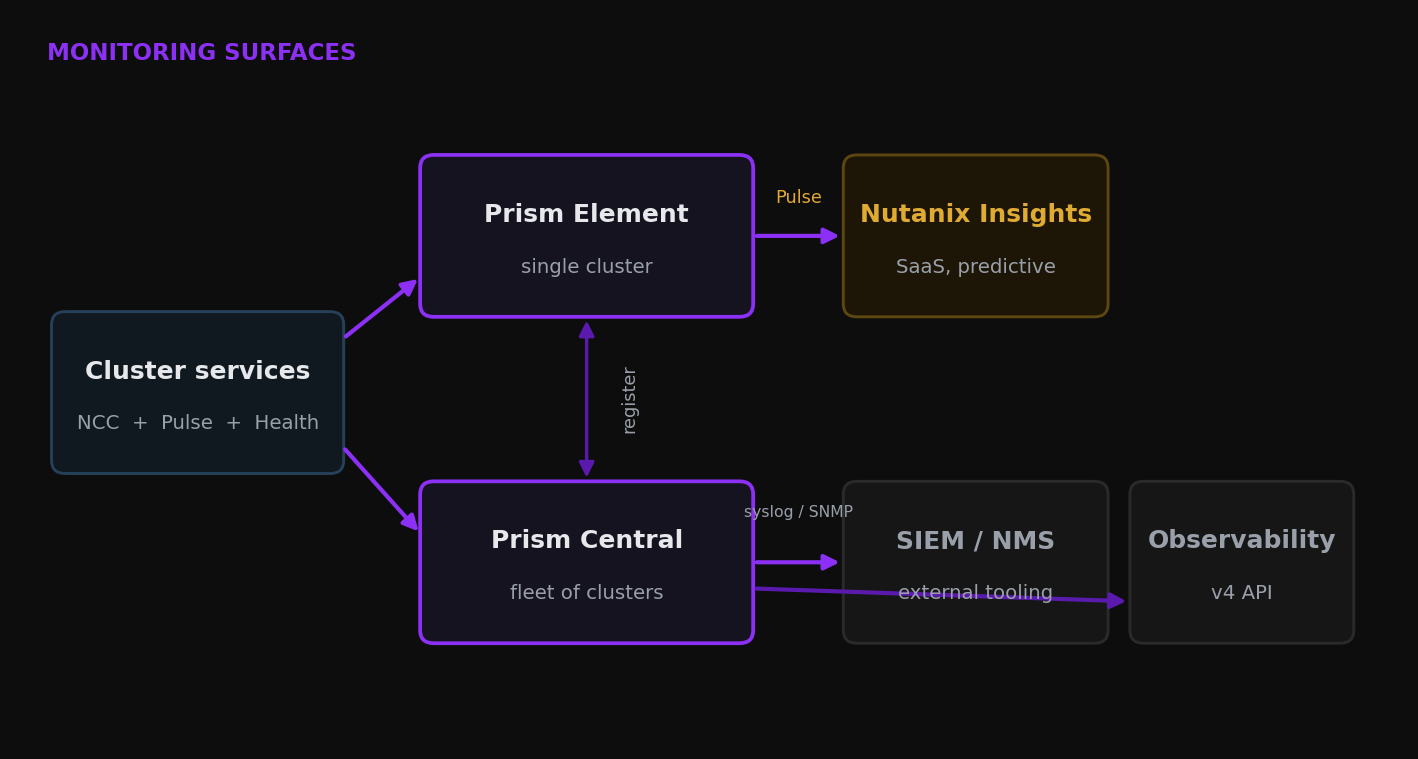
Monitoring surfaces and the direction telemetry flows out of the cluster.
HealthNutanix Cluster Check and the Health service
Nutanix Cluster Check (NCC) is the prebuilt health framework that ships with every cluster. It is cluster resident software, not an external probe, and it runs hundreds of individual checks against configuration, hardware, performance, and operational state. Each check returns a severity and, where relevant, a remediation step and a KB reference. NCC is also the package that carries Pulse, so the version of NCC on a cluster sets the baseline for both health checking and telemetry.
Two services do the work behind the dashboard. The Cluster Health service runs the checks and stores results in the Insights Data Fabric (IDF), the same distributed metadata store the rest of the platform uses. The Alert Manager service evaluates conditions and raises alerts. They are related but not identical: an NCC check can fail without producing an alert, which is the single most common reason an operator believes a cluster is healthy when it is not.
A failing NCC check does not always raise an alert, and a cleared alert does not mean the underlying check now passes. Run ncc health_checks run_all on a schedule rather than relying on alert silence as a proxy for health. Alert silence means nothing crossed an alert threshold, not that every check is green.
NCC runs from three places, and the choice matters for whoever inherits the cluster:
- Prism Element Health dashboard. The Actions menu runs all checks or a selected subset and renders results inline. Best for an operator already in the UI.
- Prism Central. On the 7.3 baseline, use Prism Element or the CLI for cluster NCC runs. Prism Central 7.5 and later can run cluster checks across registered clusters from the central console, so treat fleet wide NCC execution as an upgrade path feature, not a 7.3 design assumption.
- CLI on any CVM.
ncc health_checks run_allfor everything, or a specific module for a targeted check. This is the path automation and support both use.
If you disable a check from the Prism web console, it cannot be re run from the NCC command line until it is enabled again from the console. Disabling checks to silence a known false positive is a real operations decision with a real consequence: the check stays off everywhere until someone turns it back on through the same surface that turned it off.
AlertsAlert policies and notification
The Alert Manager is the service that turns a threshold crossing into something a person sees. Alerts carry a severity of Info, Warning, or Critical, and the policy behind each alert defines the condition, the threshold, and whether it auto resolves. Most policies ship with sensible defaults. The work is tuning the few that matter for your hardware and your workloads, and routing them somewhere that gets read.
Alert configuration is reachable from the UI and from the CLI. The CLI is useful for auditing what a cluster is actually set to rather than what someone believes it is set to:
ncli alerts get-alert-config
ncli alerts update-alert-config enable=true \
  enable-email-digest=true \
  email-contacts=ops@example.com
Notification has two delivery paths out of the box. The first is email through a configured SMTP server, sent either as individual alerts or a scheduled digest. The second is SNMP, which lets an existing network management system poll the cluster or receive traps. Both are configured per cluster in Prism Element or centrally for registered clusters in Prism Central.
| Severity | Intent | Routing decision |
|---|---|---|
| Critical | Workload impact occurring or imminent | Page a human, open a ticket automatically, never digest only |
| Warning | Degraded state, no impact yet | Ticket queue or digest, review within the working day |
| Info | State change worth recording | Log forwarding and reporting, not paging |
The default SMTP configuration is the most common silent monitoring failure on a new cluster. Email is configured but the relay rejects the cluster, or the contact list points at a distribution group nobody owns. Send a test alert and confirm a human received it. An alerting cluster nobody hears from is worse than no alerting, because it produces false confidence.
Prism Central 7.5, released in December 2025, added the ability to run NCC based health checks across multiple clusters directly from the Alerts page, and new resource allocation and consumption dashboards that show which services are consuming CPU, memory, and disk. If you are running the 7.3 baseline today, those land on the upgrade path rather than in your current console, so do not design around them yet.
TelemetryPulse and Nutanix Insights
Pulse is the telemetry channel that connects a cluster to Nutanix support intelligence. Confirm whether Pulse is enabled on each cluster. Nutanix documentation describes enabling Pulse per cluster or through Prism Central and recommends enabling it for proactive, context aware support. Do not assume telemetry is flowing just because the cluster is otherwise healthy. Once on, it transmits system level diagnostic data over an encrypted REST channel to Nutanix Insights. Pulse does not collect guest VM data, user data, or personally identifiable information such as administrator credentials. It carries configuration, health, and performance metadata about the platform itself.
Insights is what consumes that stream. It matches a cluster against the support knowledge corpus, flags known issues before they are hit, and can open support cases automatically when a critical condition is recognized. Nutanix positions this as predictive support: the cluster effectively gets continuous health review against everything the support organization has seen across the install base.
Pulse is the difference between a cluster Nutanix support can help quickly and one where every case starts from cold. The data is platform metadata, not workload contents, and the channel is encrypted end to end. Air gapped and high security environments turn it off deliberately and accept slower support engagement as the cost. For most clusters Pulse is worth enabling, because it is a choice you make once and benefit from on every case afterward.
MetricsEntities, dashboards, and reporting
Prism Central is where time series data becomes something you can hand to someone who was not watching the console. Every entity, from a single VM up to a whole cluster, exposes metrics that Prism Central retains and graphs. The value is not the live number, which Prism Element already shows. The value is the trend over time and the ability to group entities and report on them as a set.
Reporting is the feature that most operations teams underuse. Prism Central reports can mix graphs and tables, scope from individual VMs to entire clusters, group entities, carry a brand logo, and run on a schedule with the output emailed automatically. A weekly capacity and health report that lands in an inbox without anyone running it is the cheapest observability win on the platform.
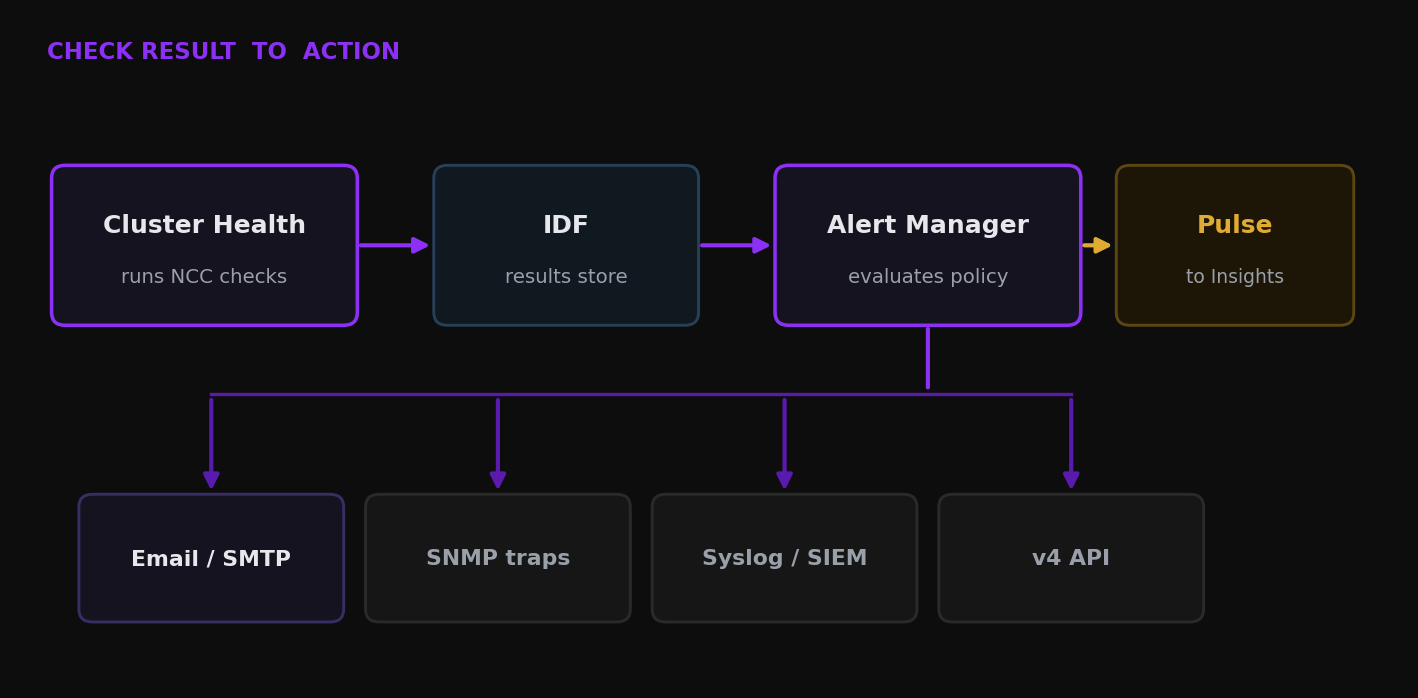
From check result to action: how a health signal reaches a human or a system.
IntegrationGetting data out: syslog, SNMP, and the API
A Nutanix cluster rarely lives alone. The operations team has a SIEM, a network monitoring system, or an observability platform, and the cluster has to feed all three. There are three exits, and they carry different data.
Syslog for audit and security events
Prism Central forwards system logs from registered clusters to an external syslog server. The forwarded sources are the audit trail, API audit, and security policy hit logs from Flow, which is what a SIEM wants. Configuration is in the UI under Settings, then Syslog server, where you set the server, port, transport, and a severity per data source. RELP is available where reliable delivery matters more than fire and forget.
Treat the Prism Central syslog target as a forwarding point, not a routing engine. Current Prism Central docs show configuring a syslog server, transport, RELP option, and selected data sources. Logs are forwarded from the Controller VM, so the source address in your SIEM is the CVM, not a friendly cluster name. If your SIEM design needs multiple destinations or richer routing, point the configured target at a log relay or aggregator and fan out from there.
For AOS and AHV level logging below what Prism Central forwards, configuration is per CVM through ncli rsyslog-config. Nutanix documents the remote syslog service as enabled by default and tells you to disable it while configuring settings, then enable it again after the server and modules are defined.
ncli rsyslog-config set-status enable=false
ncli rsyslog-config add-server name=siem host=10.10.20.5 \
  port=514 network-protocol=tcp relp-enabled=false
ncli rsyslog-config add-module server-name=siem \
  module-name=ACROPOLIS level=WARNING
ncli rsyslog-config set-status enable=true
SNMP for the network management system
AOS supports SNMP so an existing network management system can poll cluster state and receive traps. This is the right exit when the operations team already standardizes on an SNMP based tool and wants Nutanix to be one more device in the same pane. It is configured per cluster, and SNMP version 3 is the path to use for any environment where credentials on the wire are a concern.
The v4 REST API for everything else
The current Nutanix direction is the v4 API and SDK set. Legacy API versions v0.8, v1, v2, and v3 are on the deprecation path, and v4 added entity statistics that previously required the deprecated Prism Element v1 API. When you evaluate a monitoring vendor, ask whether the integration has a supported v4 path through Prism Central rather than relying on legacy Prism Element v1 statistics.
Match the exit to the consumer. Audit and security events go to syslog and the SIEM. Operational state and traps go to SNMP and the network management system. Custom metrics, dashboards, and anything you are scripting go through the v4 API. Nutanix also publishes a Prometheus exporter for Objects storage from Objects 3.5.1, if a Prometheus and Grafana stack is the house standard for object storage telemetry.
AIOpsThe intelligent operations tier
Everything above is included with the platform. The next tier up is Nutanix Cloud Manager Intelligent Operations, the licensed AIOps layer, and it changes the kind of question you can ask. Built in monitoring tells you what a metric is right now and what it was. Intelligent Operations learns the behavior of an entity over time and tells you when current behavior is anomalous relative to its own history, rather than against a static threshold someone guessed at during deployment.
That behavioral baseline is what drives anomaly detection, capacity forecasting, and the runway projections that answer when a cluster runs out of a resource. The recent NCM releases extend this with custom metrics, custom dashboards, a unified inventory browser, and aggregation across multiple Prism Central instances, so a single operations view can span environments that used to be siloed per Prism Central.
Capacity runway, forecasting, and the lifecycle decisions that follow from them are the subject of NCD-10. This article stops at the boundary where monitoring becomes planning. The thing to settle here is whether anomaly detection and forecasting are worth the license for your environment, or whether scheduled reports and well tuned alerts cover the operations model you actually run.
Failure modesSix monitoring mistakes
- Treating alert silence as health. NCC checks fail without raising alerts. A cluster that has sent no alerts is a cluster that crossed no thresholds, not a cluster that is healthy. Schedule
ncc health_checks run_alland read the output. - Never testing the notification path. SMTP misconfigured, a dead distribution list, or an SNMP trap going nowhere all produce the same outcome: alerts that fire into the void. Send a test and confirm a human received it.
- Leaving Pulse off by reflex. Pulse often sits disabled out of habit rather than a security requirement, and nobody confirms either way. For anything that is not air gapped, the support uplift is worth a one time decision.
- Forgetting Prism Central is a workload. Fleet alerting, reporting, and log forwarding all live in Prism Central. If it is a single VM with no backup and no availability plan, the monitoring plane is a single point of failure sitting on top of the thing it monitors.
- Expecting the syslog target to be a routing engine. Treat it as a forwarding point and build the fan out in a log relay, not by wishing the cluster did more.
- Buying a tool bound to the v1 API. The Prism Element v1 API is being deprecated. A third party integration that depends on it is buying a problem. Confirm v4 against Prism Central before committing.
Key Takeaways
- Three surfaces, three scopes. Prism Element owns single cluster health and survives Prism Central loss. Prism Central owns the fleet, alert policies, reporting, and log forwarding. Insights owns predictive support off cluster.
- NCC is the prebuilt health framework and carries Pulse. The Cluster Health service runs checks into the Insights Data Fabric, the Alert Manager raises alerts, and a failed check does not guarantee an alert.
- Alerts carry Info, Warning, and Critical. Tune the few policies that matter, route by severity, and test the notification path before trusting it.
- Pulse must be confirmed per cluster. Enabling it trades platform metadata, encrypted and free of guest or user data, for predictive support and automatic case creation.
- Three exits for external systems: syslog for audit and security events to a SIEM, SNMP for the network management system, and the v4 Prism Central API for everything programmatic. The v1 Prism Element API is being deprecated.
- Prism Central reporting on a schedule is the cheapest observability win available. Set it up before reaching for anything more.
- Intelligent Operations is the licensed step from static thresholds to learned behavior, anomaly detection, and forecasting. Capacity runway and the lifecycle decisions it feeds are covered in NCD-10.