Article 9 in the Proxmox VE Cluster Design Fundamentals for v9.1 series. PVCD-08 covered backup with Proxmox Backup Server. This article covers monitoring and observability: pvestatd as the metrics collector, the built in external metric server backends (Graphite, InfluxDB, and OpenTelemetry), Prometheus via the prometheus-pve-exporter, the new notification system with Gotify, SMTP, and Webhook targets, Ceph health monitoring, and the journalctl commands that turn an incident into a post mortem instead of a guess.
Monitoring is the part of cluster design that gets done last and matters first when something breaks. Proxmox does not ship a built in dashboard the way vCenter does. The web UI shows live metrics for the current view, but production retention, cluster wide visualization, and alerting need an external metrics stack. The good news is Proxmox makes the integration straightforward: pvestatd already collects the common node, guest, and storage statistics, the external metric server feature ships the data to Graphite, InfluxDB, or OpenTelemetry out of the box, and the community maintained prometheus-pve-exporter handles the Prometheus side.
This article walks the metrics pipeline, the notification system that landed in PVE 8.1 and matured in 9.x, the Ceph health story for hyperconverged clusters, and the journalctl knowledge that pays off the first time something breaks at 3 AM. Series target version is Proxmox VE 9.1. Every claim below is sourced to the External Metric Server wiki, the Notifications chapter of the Administration Guide, the prometheus-pve-exporter GitHub repository, the Ceph documentation, or linked Proxmox forum threads with Proxmox staff responses.
pvestatd: the collector that already exists
Per the External Metric Server wiki and the pvestatd source, pvestatd is the per node statistics daemon. It runs on every Proxmox VE node and gathers data about the local system, running QEMU VMs, LXC containers, storage, and the local cluster view. It is what populates the live charts in the web UI.
What pvestatd collects per the wiki and the pvestatd Perl source:
- Node level: CPU usage, memory usage, load average, network throughput per interface, root filesystem usage
- VM and container level: CPU, memory, disk I/O, network I/O, status
- Storage level: capacity, used space, status
- Time series sampling at a hardcoded 10 second interval, consistent across the pvestatd source and observed pvestatd log cadence
Gaps to cover outside the built in metric server output:
- Cluster quorum status (whether the cluster is quorate, vote counts). The data is available via
pvesh get /cluster/ha/status/currentbut is not currently pushed to the external metric servers. - Per OSD Ceph health detail. Ceph specific monitoring requires the Ceph manager modules (covered later in this article).
- Disk SMART data and wearout. Available in the GUI and via
smartctlbut not pushed to external metric servers.
The gap between what pvestatd collects and what gets shipped to external metric servers is real. For cluster status and Ceph detail you need either the Proxmox API (via Telegraf exec input or similar) or the prometheus-pve-exporter, both covered later.
Built in external metric servers
Per the External Metric Server wiki and the Proxmox VE 9.0 Roadmap, Proxmox VE has built in support for external metric targets including Graphite, InfluxDB, and OpenTelemetry. The 9.0 Roadmap introduced an OpenTelemetry plugin that pushes metrics via the OTLP/HTTP protocol to an external OpenTelemetry collector. This article focuses on Graphite and InfluxDB because they are the common PVE metric server paths, then covers Prometheus through prometheus-pve-exporter. The configuration lives in /etc/pve/status.cfg and is editable via the web UI under Datacenter, Metric Server, or directly in the file.
Graphite backend
Per the wiki: the default port is 2003 and the default Graphite path is proxmox. By default Proxmox VE sends data over UDP, so the Graphite server has to be configured to accept UDP. The MTU can be configured for environments not using the standard 1500 MTU. The plugin can also be configured to use TCP instead.
Per the wiki: in order not to block the important pvestatd statistic collection daemon, a timeout is required to cope with network problems. This matters because pvestatd is on the status collection path; a hung metric server should not block local status updates.
InfluxDB backend
Per the wiki, the InfluxDB plugin supports both UDP (for InfluxDB 1.x) and HTTP/HTTPS (for InfluxDB 2.x and the 1.8.x compatibility API). For UDP, the InfluxDB server has to be configured for it. Example InfluxDB 1.x configuration verbatim from the wiki:
For InfluxDB 2.x via the HTTP API, per the wiki: since InfluxDB's v2 API is only available with authentication, a token has to be generated that can write into the correct bucket. By default Proxmox VE uses the organization proxmox and the bucket proxmox (configurable via the organization and bucket settings). In the v2 compatible API of 1.8.x, user:password can be used as the token if required, and the organization can be omitted because it has no meaning in InfluxDB 1.x.
Per the wiki: the HTTP timeout defaults to 1 second (configurable via the timeout setting) and the maximum batch size defaults to 25000000 bytes (configurable via max-body-size, corresponding to the InfluxDB setting of the same name).
CLI configuration
Per Proxmox forum guidance, the metric server configuration in /etc/pve/status.cfg can also be edited directly. A minimal Graphite configuration:
A minimal InfluxDB v2 configuration:
Prometheus via prometheus-pve-exporter
The Prometheus path is community maintained. The canonical project is prometheus-pve-exporter. It is a Python exporter that talks to the Proxmox VE REST API, queries metrics, and exposes them in Prometheus format on a scrape endpoint (default port 9221).
Per the prometheus-pve-exporter README, the exporter requires Python 3.9 or better and can be deployed either directly on a Proxmox VE node or on a separate machine. For security, the README recommends adding a user with read only access (PVEAuditor role) for metrics collection.
User and token setup
Per the prometheus-pve-exporter README and consistent Proxmox forum threads, the recommended setup uses an API token rather than a password. The pveum commands:
Separated privileges are the safer default. The token gets its own PVEAuditor ACL. Do not disable privilege separation unless the integration genuinely needs the full permissions of the associated user.
Exporter configuration
The exporter configuration is YAML at a path you choose (commonly /etc/prometheus/pve.yml). Per the project README:
Per the README: when operating PVE with self signed certificates, set verify_ssl: false in the config or import the certificate into the local trust store. The README notes that PVE supports Let's Encrypt out of the box and that setting up trusted certificates is the better option in production.
Prometheus scrape config
Per the project README, the Prometheus scrape configuration uses the multi target scrape configuration:
This configuration lets Prometheus scrape multiple Proxmox nodes through a single exporter instance.
Collectors
Per the prometheus-pve-exporter README, the exporter exposes multiple collector groups, controllable via the --collector.X and --no-collector.X flags:
- status. Node, VM, container status (online, running)
- version. PVE version info
- node. PVE node info
- cluster. PVE cluster info
- resources. PVE resources info
- backup-info. Information about guests not covered by any backup job
- config. PVE onboot status (per node)
- replication. PVE replication info (per node)
- subscription. PVE subscription info (per node)
Per the README, the config collector results in one API call per guest VM or container. It is recommended to disable this collector with --no-collector.config on big deployments.
Per the project releases, the exporter added pve_ha_state and pve_lock_state metrics in v3.5.0 (released January 2025). For HA configured clusters this fills part of the gap that the built in metric server leaves.
Ceph health monitoring
Per the Ceph documentation and Proxmox Ceph wiki, Ceph cluster health is exposed via the standard Ceph CLI tools, which are available on every Proxmox node that participates in a Ceph cluster. The command set is the same as upstream Ceph.
The CLI commands that matter
Per the Ceph documentation, the health states:
- HEALTH_OK. All OSDs up and in, all PGs active+clean, MON quorum stable, no warnings.
- HEALTH_WARN. Capacity warnings (nearfull, backfillfull), slow OSDs, rebalancing in progress, recoverable degraded states. Investigate, but the cluster is serving I/O.
- HEALTH_ERR. A condition that prevents some I/O or risks data loss. PG inactive, OSD full, MON quorum lost. Stop and address before doing anything else.
Ceph in the Proxmox UI
Per the Proxmox Ceph wiki, the Datacenter, Ceph panel in the web UI provides a live view of cluster health, OSD status, MON status, and pool usage. It is sufficient for ad hoc visibility but does not retain history. For trend analysis (OSD usage over weeks, PG count drift, recovery duration) a metrics pipeline is needed.
Ceph metrics into Prometheus
Per the Ceph documentation, the Ceph manager (ceph-mgr) ships with a Prometheus module that can be enabled to export Ceph metrics directly. On a Proxmox HCI cluster:
The Ceph manager Prometheus module exposes Ceph metrics on port 9283. It includes health check metrics and cluster level data. Some detailed metrics need explicit configuration. RBD per image I/O statistics require mgr/prometheus/rbd_stats_pools. Ceph daemon performance counters are not exported by the manager module by default in newer Ceph behavior when ceph-exporter is used. Verify which Ceph metrics your Proxmox build exposes before building dashboards that depend on per OSD latency or per image I/O.
Scrape manager endpoints or put discovery/proxy behavior behind them deliberately. Ceph has active and standby manager behavior, and standby response behavior is configurable. Configuring all manager nodes as scrape targets means metrics keep flowing across manager failovers without manual reconfiguration.
Maintenance flags
Per the Ceph documentation, during planned maintenance (host reboot for kernel update, hardware swap, etc), set the noout flag to prevent unnecessary recovery while OSDs are temporarily down:
Per the Ceph docs, additional flags for sensitive interventions: norecover and norebalance pause data movement entirely. Always unset these flags after maintenance; leaving them set degrades cluster resilience.
The notification system
Per the Proxmox VE Notifications chapter of the Administration Guide, Proxmox VE 8.1 introduced a unified notification system that supersedes the old root mail behavior. The system has matured through 8.x and continues in 9.x.
Architecture
Per the Notifications chapter, the system has three components:
- Notification events. Backup job completion, fencing, package updates available, Ceph health changes, replication errors, ZFS scrub results, etc. Each event has metadata fields (severity, type, hostname, etc).
- Notification matchers. Rules that match on event metadata (severity, type, time, hostname) and route events to one or more targets.
- Notification targets. The destinations: sendmail, SMTP, Gotify, and Webhook (introduced in PVE 8.3).
Per the Administration Guide: the configuration is stored in /etc/pve/notifications.cfg and /etc/pve/priv/notifications.cfg. The latter contains sensitive options like passwords and authentication tokens and can only be read by root.
Target types
Per the Notifications chapter:
- Sendmail. Uses the system's sendmail binary to email a configured list of users or addresses. The default in fresh installs is
mail-to-rootwhich delivers to root's local mail spool. Reasonable for single host labs, useless for production. - SMTP. Authenticated SMTP relay with SSL/TLS. The right answer for production: configure an external SMTP relay (your existing mail infrastructure or a transactional service) so notifications actually reach humans.
- Gotify. Push notifications via a Gotify server. Tokens are generated in the Gotify web interface. Good fit if your team already runs Gotify for push.
- Webhook. HTTP request to a configurable URL with a templated body. Introduced in PVE 8.3 per the Administration Guide. Routes notifications to chat platforms (Slack, Discord, Mattermost, Teams) or to your own incident management ingest.
Webhook templating
Per the Administration Guide, Webhook bodies and headers use Handlebars templates. A minimal webhook body using the templated title and message fields:
Per the docs, the escape helper handles JSON escaping for special characters (newlines, quotes, control characters) so the payload stays valid JSON. Without escape, multi line backup notifications break the JSON body and the webhook target rejects them with HTTP 400. For chat platforms with character limits (Discord caps webhook content at 2000 characters per the Discord API), oversized notifications also get rejected. Per Proxmox forum threads, the workaround for Discord specifically is to use a custom Handlebars template that omits the logs section, since vzdump backup notifications can exceed the limit on multi VM jobs.
Matchers
Per the Administration Guide, matchers route events to targets based on rules. A matcher can match on:
- Severity (info, notice, warning, error, unknown). Per the docs, system-mail events from local daemons like smartd come through with severity unknown.
- Type (fencing, replication, package-updates, vzdump, system-mail, etc)
- Time of day and day of week
- Specific metadata fields with regex
The classic operational design: warning and error severities go to an on call channel (Webhook to Slack or PagerDuty), info notices go to a logging endpoint (or are dropped), and the daily backup notifications go to a separate Webhook target that posts to a backup status channel without paging anyone.
Per the Administration Guide, backup jobs still support a legacy notification mode that sends mail directly via the sendmail binary using only the email address configured in the backup job, bypassing the global notification matchers. This mode exists for compatibility with pre 8.1 behavior and may be removed in a future release. For new deployments, use the notification system mode (the default in PVE 9.x) so matchers and targets actually apply.
journalctl commands for incident triage
Proxmox VE is a Debian system; everything goes through systemd journald. journalctl is the universal entry point. The commands that matter operationally:
Service specific logs
Time bounded queries
Boot scoped queries
The -b -1 command is essential after a node has been rebooted (planned or unplanned). It scopes journalctl to the previous boot's logs so you can see what happened before the reboot without filtering through the current boot.
Priority filtering
Per systemd journal documentation, the priority levels (lowest to highest): debug, info, notice, warning, err, crit, alert, emerg. -p err matches err and higher (crit, alert, emerg).
Kernel messages and hardware events
For SCSI errors, NVMe issues, network interface up/down events, kernel messages are the primary source. Combine with dmesg --human --kernel --level=err,crit,alert,emerg for a focused view.
Centralized logging
Per Debian and systemd documentation, journald can forward logs to a central syslog server with ForwardToSyslog=yes in /etc/systemd/journald.conf. For production clusters, central log aggregation (rsyslog forwarding to a Loki instance, a SIEM, or a Splunk indexer) is the right answer. Local journald retention is bounded; central retention is the post mortem source of truth.
Putting it together: what a production stack looks like
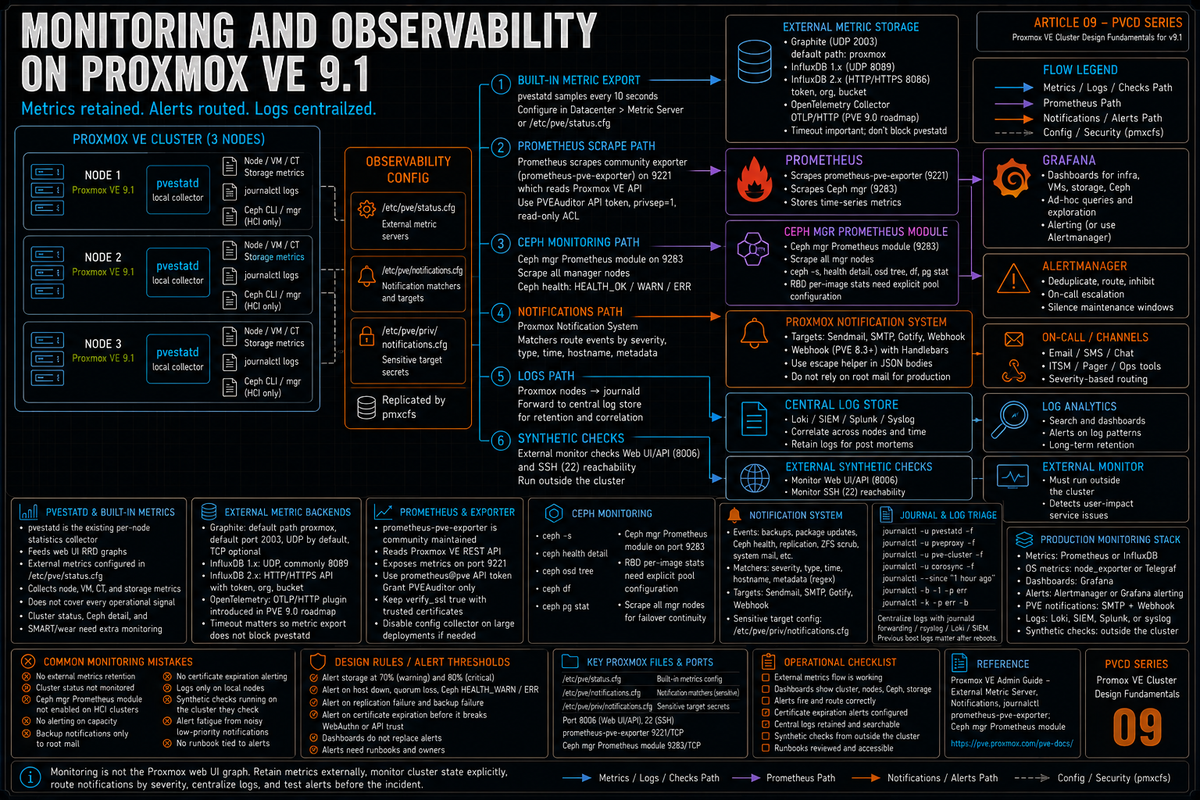
The reference monitoring stack for a production Proxmox 9.1 cluster:
- Metrics pipeline. Either Prometheus (prometheus-pve-exporter plus Ceph mgr Prometheus module on HCI clusters, plus node_exporter on each node for OS level metrics) or InfluxDB plus Telegraf (with the Proxmox built in InfluxDB target plus Telegraf for any gaps).
- Visualization. Grafana with cluster, node, and per VM dashboards. The community maintains Grafana dashboard 10347 for prometheus-pve-exporter as a starting point; expect to customize.
- Alerting. Alertmanager (with Prometheus) or Grafana alerting (with InfluxDB or Prometheus) for capacity, host down, Ceph health, replication failure, backup failure. Webhook to Slack, Teams, or PagerDuty for routing.
- Notification system. Configure SMTP and Webhook targets in PVE Notifications. Route fencing and Ceph errors to on call. Route backup notifications to a backup channel. Disable legacy sendmail backup mode in favor of the notification system.
- Log aggregation. Forward journald to a central log store. Loki plus Grafana for self hosted; commercial SIEM if you have one. Set central log retention to match your incident review, compliance, and support requirements. Thirty days is a practical starting point, not a universal minimum.
- Synthetic checks. External tools (Uptime Kuma, Smokeping, or commercial monitoring) hitting the web UI and SSH on each node from outside the cluster. Confirms the cluster is reachable from the network the operators actually use.
The monitoring design mistakes that bite you later
No external metrics retention
The Proxmox web UI graphs are useful for local spot checks, but they are not a monitoring system. They use RRD data, lose detail as data ages, and do not provide alerting, cluster wide dashboards, or long term investigation workflows. Use an external metrics stack for production retention and alerting. Even a small external metrics store with useful retention can make incident review much easier.
Cluster status not monitored
Current built in metric server output does not cover every operational signal. A node can lose quorum while the metric pipeline still shows healthy node metrics. Use prometheus-pve-exporter (which exposes cluster info) or a Telegraf exec input running pvecm status periodically. Verify quorum is in the alerting layer.
Ceph manager Prometheus module not enabled
The PVE built in metric server does not include detailed Ceph metrics. On HCI clusters this leaves the storage tier opaque. Enable the Ceph manager Prometheus module, scrape all manager nodes, and dashboard OSD usage, PG counts, scrub progress, and recovery throughput. The first time a Ceph PG goes inactive in production is not when you want to discover the dashboard does not exist.
No alerting on capacity
ZFS pools, Ceph pools, and PBS datastores all have a point of no return where free space falls below the operational threshold. Alert at 70% used (warning) and 80% used (critical) on every storage pool. The lead time matters: discovering at 95% used means a fire drill, alerting at 70% means a planned hardware order.
Backup notifications going only to root mail
Default Proxmox installs send backup notifications to root@hostname. Nobody reads root mail. Configure the SMTP target in Notifications to deliver to a real distribution list, and add a Webhook target to a chat channel. Backup failures are the kind of notification that should be loud.
No alerting on certificate expiration
Let's Encrypt renews automatically until it does not (DNS challenge misconfiguration, ACME endpoint changes, account expiration). Monitor cert expiration as a metric (Prometheus blackbox_exporter or a synthetic check). Catching this 30 days out is trivial; catching it the morning the cert expires breaks every browser session and every WebAuthn login.
Logs only on the local nodes
journald retention defaults are bounded by disk size and configurable retention. After a serious incident on a node that loses its boot disk, the local logs are gone. Forward to a central log store. Retention there is the post mortem source of truth, not the node itself.
Synthetic checks running on the cluster they are checking
An Uptime Kuma instance running as a VM on the cluster cannot tell you the cluster is down because it is also down. External synthetic checks (a small VM somewhere else, a SaaS monitoring service, the second cluster you operate) need to be the source of truth for "is the cluster reachable from the outside."
Alert fatigue from too many low priority notifications
Every package update, every successful backup, every routine ZFS scrub goes to the same channel as fencing events and Ceph errors. The team learns to ignore the channel. Use notification matchers to route info severity to a logging endpoint or a separate channel; route warning and error severities to the channel humans actually read. Alerts should mean something.
No runbook tied to alerts
An alert that fires at 3 AM and tells the on call engineer "Ceph HEALTH_WARN" but provides no context on what to check, what is normal, or who to escalate to is half useful. Every alert should link to a runbook entry: what the alert means, what to verify first, what known causes exist, what action to take, who to call if the action does not resolve. The runbook is the second half of the alert.
Key Takeaways
- pvestatd is the existing collector. Per the External Metric Server wiki, it samples node, VM, container, and storage metrics at a hardcoded 10 second interval consistent with the pvestatd source and observed pvestatd log cadence. The data is what populates the web UI graphs and what gets shipped to external metric servers.
- Built in Graphite, InfluxDB, and OpenTelemetry. Graphite and InfluxDB per the External Metric Server wiki; OpenTelemetry plugin per the PVE 9.0 Roadmap. Configure under Datacenter, Metric Server or in
/etc/pve/status.cfg. Default Graphite port 2003 over UDP; InfluxDB v1 over UDP on 8089 or v2 via HTTP API with bucket and token. - Cluster status, Ceph detail, and SMART are gaps. Current built in metric server output does not cover every operational signal. For quorum, Ceph detail, and SMART or wear data, use the Proxmox API, prometheus-pve-exporter, Ceph Prometheus metrics, node exporter, smartctl, or Telegraf depending on the signal.
- prometheus-pve-exporter for Prometheus. Community maintained at github.com/prometheus-pve/prometheus-pve-exporter. Use a PVEAuditor user with an API token. Multi target Prometheus scrape configuration covers multiple PVE nodes via a single exporter. Disable the config collector on big deployments.
- Ceph CLI plus Ceph manager Prometheus module. Per the Ceph documentation,
ceph -s,ceph health detail,ceph osd df tree,ceph -wfor live triage. Enable the manager Prometheus module on port 9283 and scrape all manager nodes; verify which Ceph metrics your build exposes before depending on per OSD latency or per image I/O. - Notification system landed in PVE 8.1. Per the Administration Guide. Sendmail, SMTP, Gotify, Webhook (Webhook added in 8.3) targets. Matchers route by severity, type, time, and metadata regex. Configuration in
/etc/pve/notifications.cfgand/etc/pve/priv/notifications.cfg. - Webhook templating uses Handlebars. Per the docs. The
escapehelper handles JSON escaping for special characters; without it multi line notifications break the JSON payload. - journalctl commands matter operationally.
-u <service>for per service logs,-b -1for previous boot,-p errfor priority filter,-kfor kernel. Forward to a central log store for post mortems. - The reference stack. Prometheus or InfluxDB for metrics; Grafana for visualization; Alertmanager or Grafana alerting; PVE Notifications with SMTP and Webhook; central log store; external synthetic checks running off the cluster they monitor.
- Capacity alerting at 70% and 80% used. ZFS pools, Ceph pools, PBS datastores. The 70% warning gives lead time for hardware orders; 80% critical means the change window is now.